Step up your coding game with AI-powered Code Explainer. Get insights like never before!
Data cleaning is a process for preparing a dataset for further analysis. During the data cleaning phase, we standardize the data in our dataset by removing any values that could lead to erroneous conclusions.
Drawing conclusions based on faulty data can have costly or disastrous consequences, so it is important to base our analysis on clean data.
In this tutorial, we will explore several techniques for cleaning data, so we can conduct an analysis with our dataset in the best possible condition.
Table of content:
Generating the Dataset
We will generate our own dirty data to guarantee that we can practice multiple data cleaning techniques on one dataset. We will simulate a dataset that represents data collected on donors across the United States for a particular organization.
Information has been collected to capture these donors' names, addresses, and donation amounts. We will simulate dirty data by randomly introducing inconsistencies in the dataset.
Simulation Code
We will build our simulation code by creating a set of helper functions. Go ahead and create a file named helpers.py and import the random module into helpers.py. Once you do that, add the following functions:
import random

def add_donations(rows):
    total_donations = len(rows)
    donations = []
    # create list of random donation values
    donations = list_of_donations(total_donations)
    # add donations onto main records
    count = 0
    while count < total_donations:
        rows[count].append(donations[count])
        count += 1

def create_row_base():
    first_name_options = ['Rosemaria', 'Jodi', 'Alvy', 'Blake', 'Ellis', '']
    last_name_options = ['Roderick', 'Hesbrook', 'Summerton', 'Rappport', 'Alben', '']
    city_options = ['Hialeah', 'Arlington', 'Springfield', 'Carrollton', 'Cambridge', '']
    state_options = ['CT', 'NY', 'VA', 'WA', 'AZ', '']
    first_name = random.choice(first_name_options)
    last_name = random.choice(last_name_options)
    street =  street_address()
    city = random.choice(city_options)
    state = random.choice(state_options)
    return [first_name, last_name, street, city, state]

def list_of_donations(size):
    donations = []
    donation_amt = random_dollar_amt()
    for i in range(size):
        # randomly change donation value
        if random.choice([1, 2, 3, 4, 5]) > 1:
            donation_amt = random_dollar_amt()
        donations.append(donation_amt)
    return donations

def random_dollar_amt():
    dollars = random.randint(-50, 200)
    cents = random.randint(0, 99)
    return '${}.{}'.format(dollars, cents)

def scramble_capitalization(str):
    final_str = ''
    for letter in str:
        final_str += random.choice([letter.upper(), letter.lower()])
    return final_str

def street_address():
    num = random.randint(40,1001)
    road_name = random.choice(['Western Plank', 'Forest Run', 'Kings', 'Oaktree'])
    road_type = random.choice(['Street', 'St', 'Road', 'Rd', ''])
    address = '{} {} {}'.format(num, road_name, road_type)
    return address
The add_donations() function takes a list of data rows as an argument. In our simulator, the list of data rows that will be passed to this function are the base records that have just the first_name, last_name, street_address, city, and state.
The create_row_base() function is used to generate the name and address-related values for the records in our dataset.
The list_of_donations() function is used to generate a list of random donation values. Some of these values will be repeated. This function will be called inside the add_donations() function.
The random_dollar_amount() function is used to generate random dollar values - including some negative values.
The scramble_capitalization() function is used to make the formatting of the street addresses inconsistent.
Finally, the street_address() function is used to generate street addresses. Notice that the empty string ('') can be selected for the road_type. The empty string option is there, so we will have data with missing values.
Now that we have walked through all the functions in the helpers module, let's talk about our main simulator script. Create a new Python script named simulator.py and import the following modules:
import csv
import random
import helpers
We need the csv module because we will output our generated data into a CSV file. The random module has several helpful tools for random number generation that we will use to make our dataset inconsistent.
Finally, the helpers module gives us access to all the helper functions we created earlier.
After the import statements, add the following code to complete our simulator:
def generate_dataset():
    rows = []
    count = 0
    # generate list of base records: names data + address data
    while count < 20:
        row_to_add = helpers.create_row_base()
        rows.append(row_to_add)
        # randomly add duplicate records
        if random.choice([1, 2, 3, 4, 5]) > 2:
            rows.append(row_to_add.copy())
            # scramble formatting of street address
            rows[-1][2] = helpers.scramble_capitalization(rows[-1][2])
        count += 1
    # add donation amounts to each record
    helpers.add_donations(rows)
    return rows

with open('simulated_data.csv', 'w') as f:
    f_csv = csv.writer(f)
    # write headers first
    f_csv.writerow(['first_name','last_name','street_address',
        'city','state', 'donation'])
    f_csv.writerows(generate_dataset())
The simulator.py script pictured above generates a dataset with the following headers:
first_name, last_name, street_address, city, state, donation
The dataset includes values that exemplify various types of problems that will need to be cleaned up.
When you run the simulator.py file, a .csv file named simulated_data.csv will be generated in the same directory as the simulator.py file.
We will use the data in the simulated_data.csv file to practice data cleaning.
Diagnosing Problems
Before we begin the data cleaning process, we need to diagnose the problems in our dataset. To diagnose problems, we first need to have context.
Having context means we need to understand the data's domain, have a particular use case for the dataset in mind, and learn as much as possible about how the data was collected. By establishing context, we can develop a feeling of where to hunt for potential problems.
As mentioned above, we know our dataset represents information about donors for a particular organization that lives in various locations across the United States.
Our task is to find information on the amount of money donated by donors living in certain regions of the United States. We also know that all values in our dataset are stored as strings.
With that context in mind, let's create a new script in which we will use pandas to explore our dataset and begin looking for issues that may need cleaning:
import pandas as pd

# Config settings
pd.set_option('max_columns', None)
pd.set_option('max_rows', 12)
# Import CSV data
data_frames = pd.read_csv (r'simulated_data.csv')
print(data_frames.head(10))
We use the set_option() function to change the default settings for the number of columns and rows that are displayed whenever we print data_frames to the console. Changing these settings will allow us to see every column in our dataset and more rows than would otherwise be displayed.
Next, we import our data file into pandas. Then, we print out the first ten rows of our data.
Running this script generates the following output:
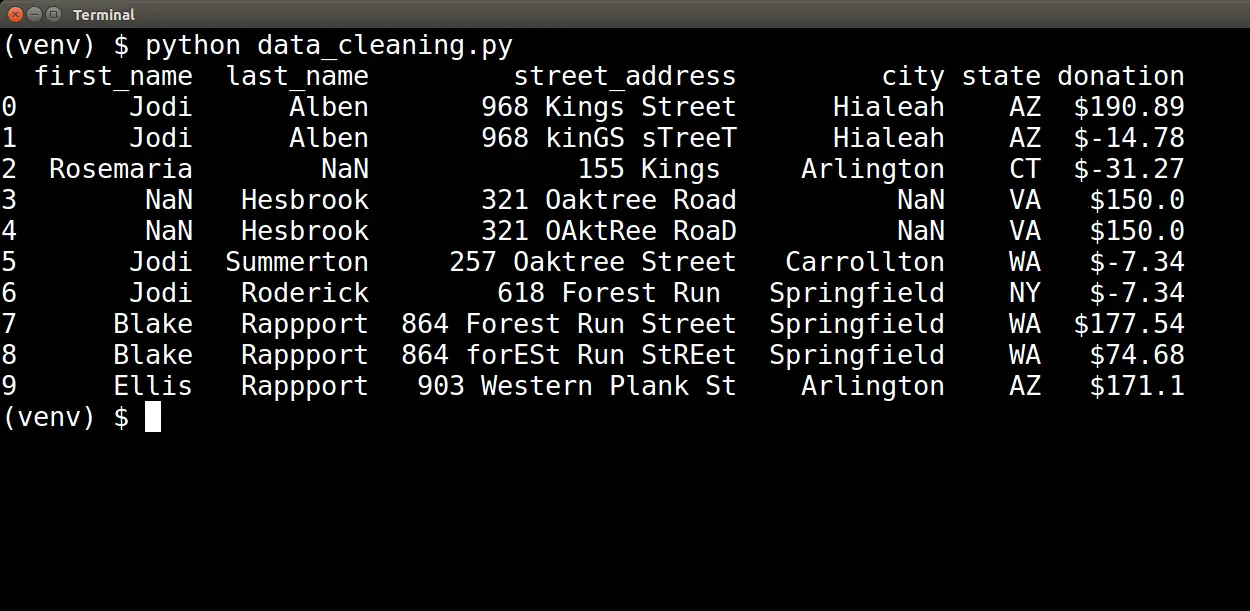
Visual Inspections
Upon visual inspection, we can identify several issues. First, we see the value NaN several times in our data. NaN is how pandas represent values that are missing.
Also, we can see street addresses that are inconsistent. "864 Forest Run Street" and "864 forESt Run StREet" represent the same address, although their casing differs. We do not want these to be treated as different addresses, so we must clean up this inconsistency.
Finally, in the donation column, we see negative dollar amounts. A negative dollar amount does not make sense within the context of donations. These values are out-of-range, so we must determine how to handle them.
Visual inspection of the data helped us diagnose missing values, inconsistent data, and out-of-range values. However, we do not need to rely on visual inspection alone. Pandas have other tools we can use to diagnose these and other issues as well.
Other Diagnostic Tools
What if "dirty" data values were not present in our visual sample? There are other ways to diagnose a dataset's problems using pandas.
For example, to determine if there are missing values, you can run the following script:
import pandas as pd

# Config settings
pd.set_option('max_columns', None)
pd.set_option('max_rows', 12)
# Import CSV data
data_frames = pd.read_csv (r'simulated_data.csv')
print(data_frames.info())
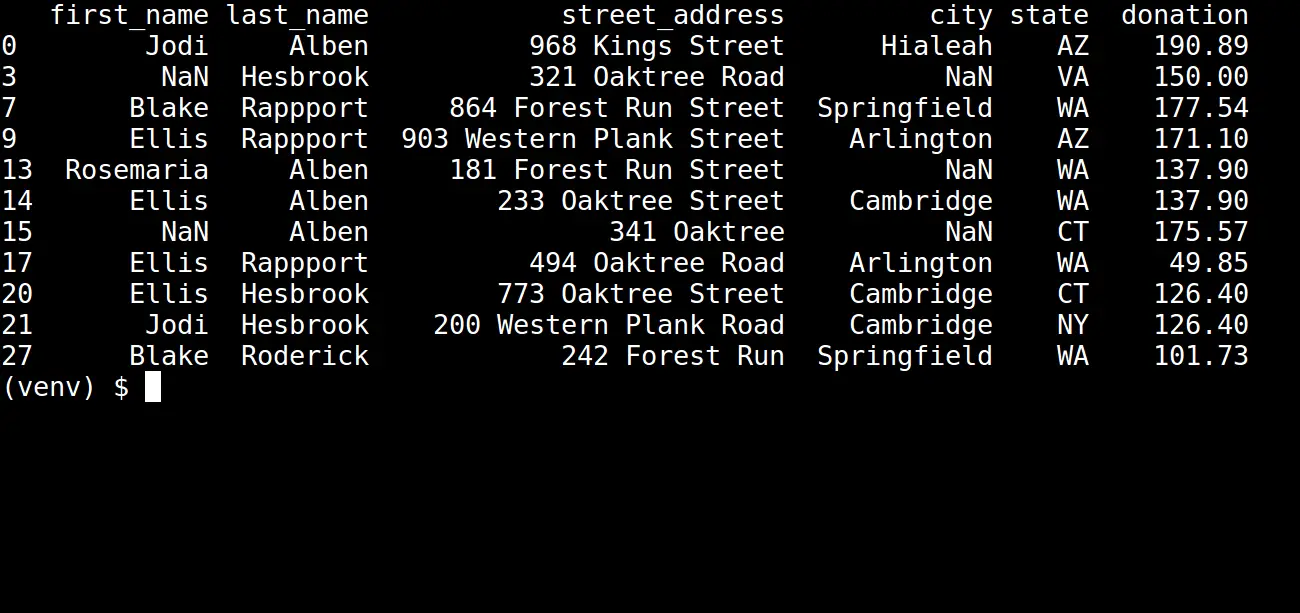
Calling the info() method on our dataframe and printing the output of that method call gives us the following table:
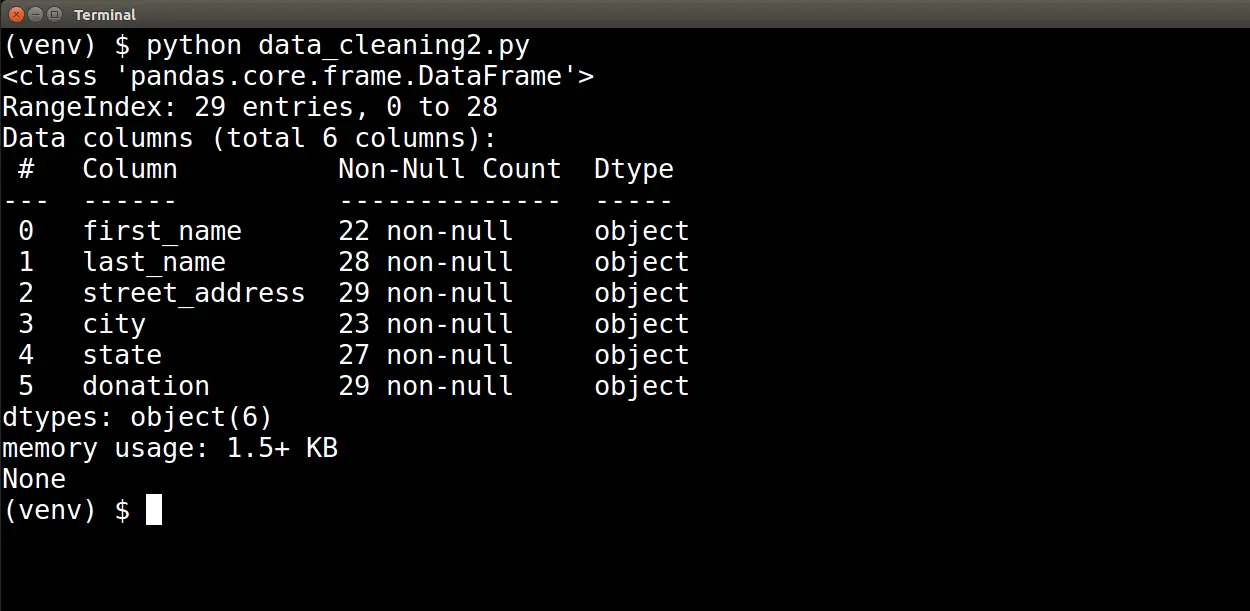
At the top of the output, we see the following two lines:
RangeIndex: 29 entries, 0 to 28
Data columns (total 6 columns):
This indicates that our dataset contains twenty-nine records and six attributes. Below this information, we see a table that lists total non-null entries and the data type for each of the six attributes.
Based on this table, we can see that the first_name, last_name, city, and state attributes all have missing values. Furthermore, this table also lets us know that the data type of the donation attribute is not numerical.
Given that we will need to perform mathematical calculations on the donation value, this table helped us diagnose a data type issue.
Pandas has another powerful tool that will help us diagnose duplication of records. However, we need to clean the data up a bit before applying it.
Let's go ahead and start cleaning up some of the issues we diagnosed in our dataset.
Cleaning the Data
Data Types
First, we will tackle the data type issue we just discovered. Currently, donation-related values have a type of object. Pandas uses the object data type for strings. We need to convert from the object data type into a numerical data type.
But first, let's take another quick look at the strings in the donation column. Notice that these strings start with a dollar symbol ($):

Before attempting to convert these strings into numbers, we need to eliminate the dollar symbol. We can remove the dollar symbol from the donation values by using the following code:
data_frames['donation'] = data_frames['donation'].str.strip('$')To cast the donation values from a string to a float, we can use the following code:
data_frames['donation'] = data_frames['donation'].astype('float64')Create another script that puts all this together:
import pandas as pd

# Config settings
pd.set_option('max_columns', None)
pd.set_option('max_rows', 12)
# Import CSV data
data_frames = pd.read_csv (r'simulated_data.csv')
# Data Type Conversion
# Remove '$' from donation strings
data_frames['donation'] = data_frames['donation'].str.strip('$')
# Convert donation stings into numerical data type
data_frames['donation'] = data_frames['donation'].astype('float64')
print(data_frames.head(10))
print(data_frames.info())
Running the script above will produce the following two tables:
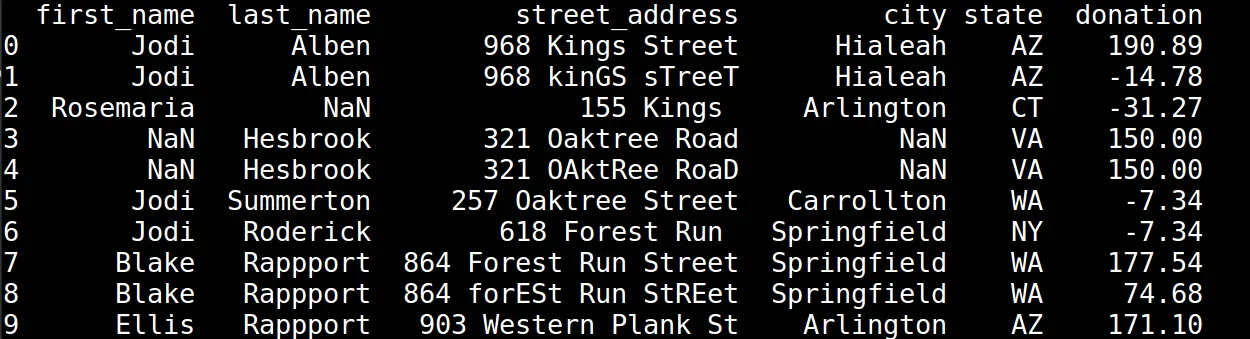
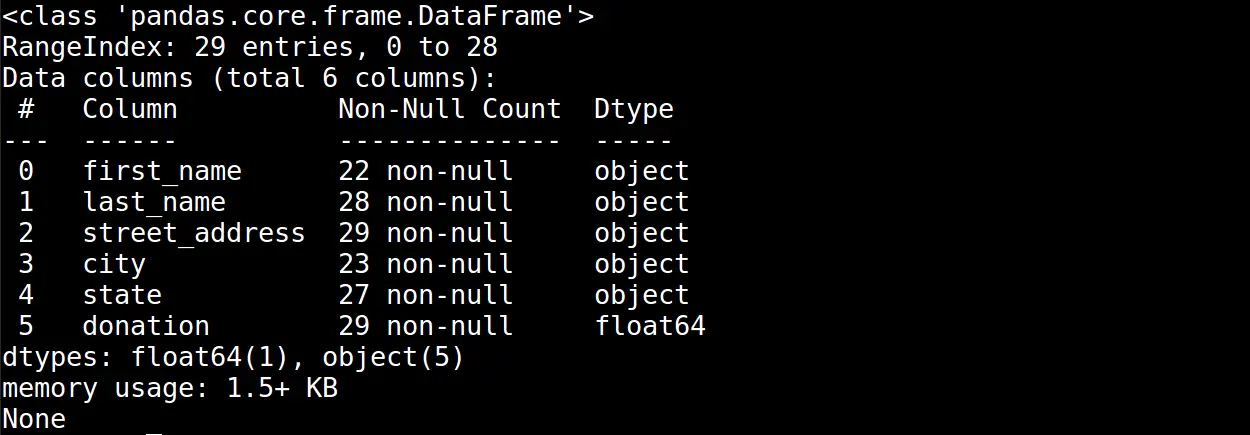
As you can see, the donation values are represented with a numerical data type. Now we will be able to run calculations on those values.
Inconsistency
Now that we have addressed the data type issues we diagnosed, let's turn to the problem of inconsistent data. In our diagnostic step, we saw data inconsistency in the street_address attribute:
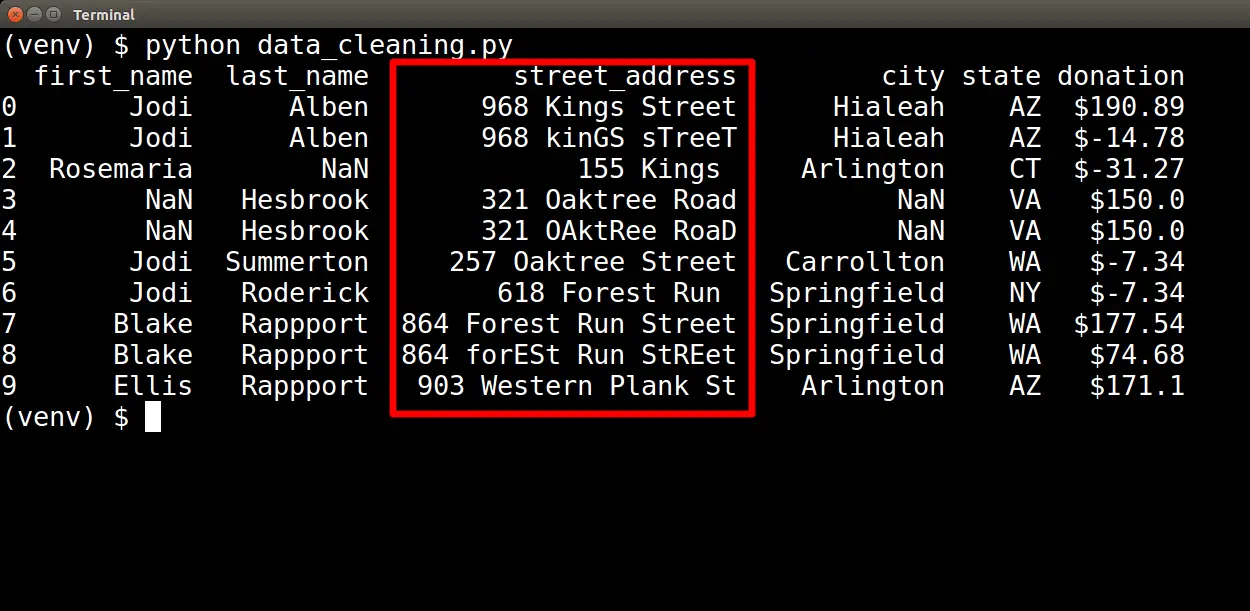
There are three types of inconsistencies here. First, we have inconsistent capitalization. Next, we have inconsistent usage of abbreviations. For example, in some cases, we see "Street," while in others, we see "St."
And finally, we have some incomplete street addresses, such as "155 Kings", as pictured above.
To clean up the capitalization issue, we will add the following code to the script we used to convert the donation data type:
import pandas as pd

# Config settings
pd.set_option('max_columns', None)
pd.set_option('max_rows', 12)
# Import CSV data
data_frames = pd.read_csv (r'simulated_data.csv')
# Data Type Conversion
# Remove '$' from donation strings
data_frames['donation'] = data_frames['donation'].str.strip('$')
# Convert donation stings into numerical data type
data_frames['donation'] = data_frames['donation'].astype('float64')
# Handle Data Inconsistencies
# Capitalize strings
data_frames['street_address'] = data_frames['street_address'].str.split()

def capitalize_words(arr):
    for index, word in enumerate(arr):
        if index == 0:
            pass
        else:
            arr[index] = word.capitalize()

data_frames['street_address'].apply(lambda x: capitalize_words(x))
data_frames['street_address'] = data_frames['street_address'].str.join(' ')
print(data_frames['street_address'])
On line 20, we use:
data_frames['donation'].str.split()To break the street_address string into a list of strings. From there, we will need to apply a function to each row in the street_address series.
To do that, we will create a function that capitalizes every string in the list except for the first string. We skip the first string because that string represents the number part of the street_address. The number does not require capitalization.
Once we have the function that we want to apply to each row of the street_address series, we can use the following code to apply the function:
data_frames['street_address'].apply(lambda x: capitalize_words(x))At this point, our street_address series contains a list of strings wherein all strings (except for the first string) are capitalized.
We need to take the final step of converting the list of strings back into a single string with each word separated by a space (' '). We can do that by using the following line of code:
data_frames['street_address'].str.join(' ')Once we have added all of these updates to our script, we can run the script to produce the following printout of the street_address series:
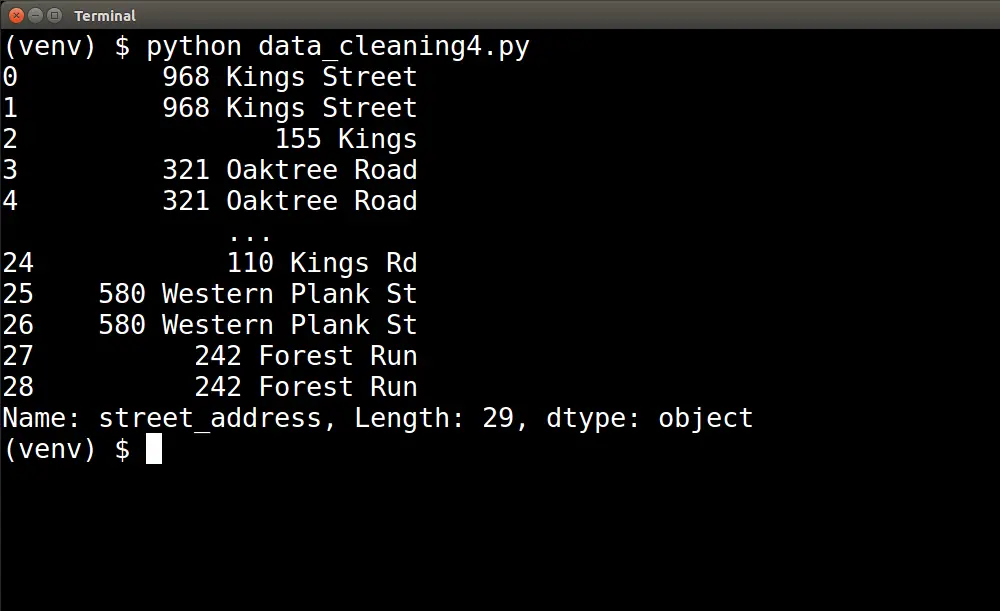 Notice that the capitalization for each word in the address has been cleaned up and standardized; only the first letter of each word is capitalized.
Now we need to handle the second inconsistency issue: inconsistent usage of abbreviations. Let's extend the code we just created for capitalizations. Here, we combine the work of capitalizing each word in the string with that of expanding abbreviated road types.
data_frames['street_address'] = data_frames['street_address'].str.split()

def normalize_words(arr):
    for index, word in enumerate(arr):
        if index == 0:
            pass
        else:
            arr[index] = normalize(word)

def normalize(word):
    if word.lower() == 'st':
        word = 'street'
    elif word.lower() == 'rd':
        word = 'road'
    return word.capitalize()

data_frames['street_address'].apply(lambda x: normalize_words(x))
data_frames['street_address'] = data_frames['street_address'].str.join(' ')
print(data_frames.head(10))
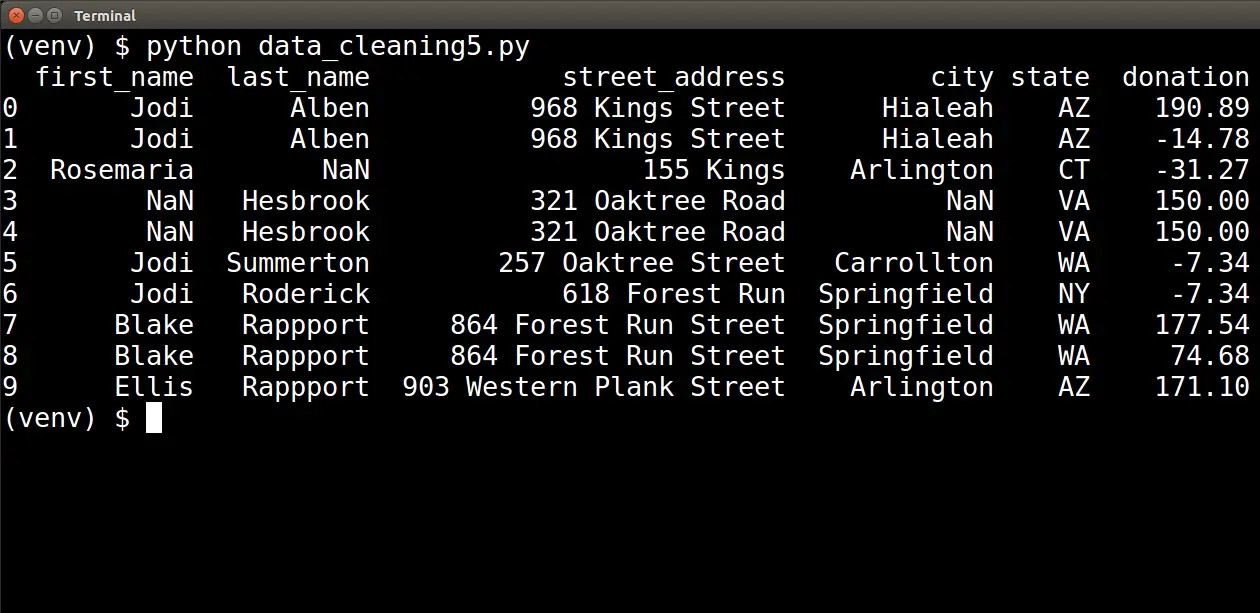
When we run the updated script pictured above, we will see the following:
Finally, we must decide what to do with incomplete addresses. This is where we must rely on context once again to help guide our decision. We must determine whether those errors indicate garbage data that we do not want to include in our analysis.
For our purposes in this article, we will leave records with incomplete addresses at this stage.
An incomplete street_address is not enough of a signal for garbage data to discard the entire row. We will look to other indicators in the next steps that are stronger signals of garbage data that needs to be discarded.
Out-Of-Range and Duplicate Values
Next, we need to look at the outliers in our dataset. As mentioned before, any negative donation values do not make sense within the context of our problem domain. If we include these negative values in our donation calculations, they will erroneously skew our totals.
This is a strong signal for garbage data, so we will simply filter out any records with negative donation values.
To filter out records that have negative donation values, we can add the following code to our script:
# Remove Out-of-Range Data
# create boolean Series for out of range donations
out_of_range = data_frames['donation'] < 0
# keep only the rows that are NOT out of range
data_frames['donation'] = data_frames['donation'][~out_of_range]
print(data_frames.head(10))
We create a Boolean Series and assign it to the out_of_range variable. The Boolean Series is based on whether a value in the donation column is less than zero.
We then use that Boolean Series to filter out the negative values in our donation Series. We keep those values that are not out of range.
Once we run the updated script, we should be able to see the following table:
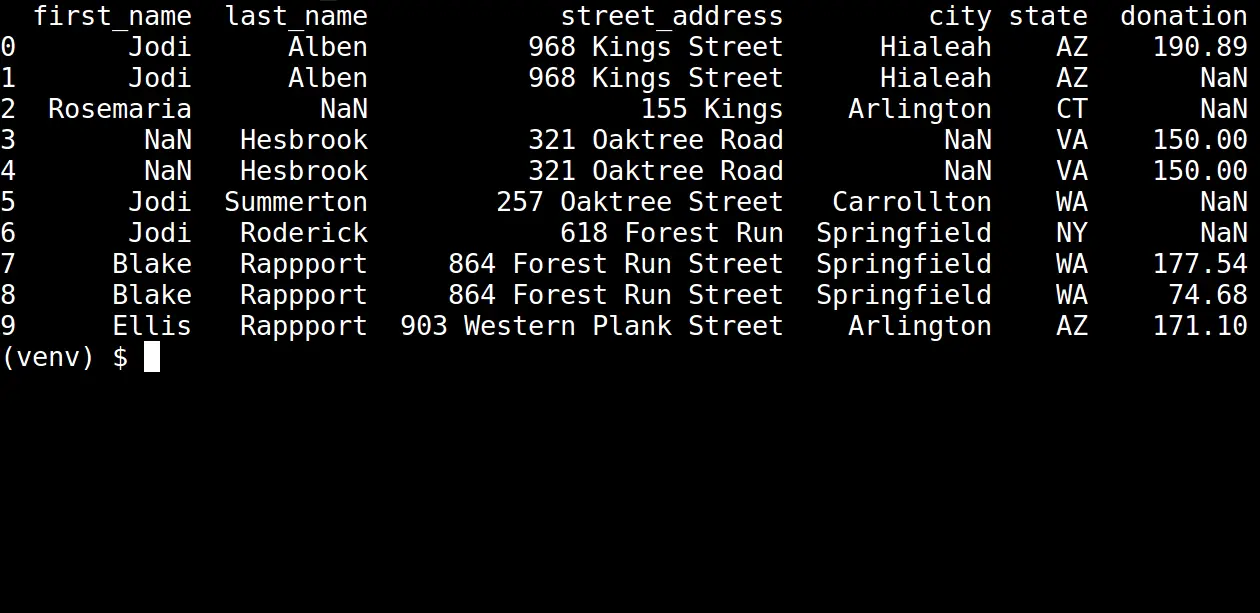
Notice that all the negative donation values have been filtered out. In the table, the value NaN indicates there is no longer a value there.
Duplicate records should also be removed from our dataset. In our donor scenario, it is unlikely to have a duplicate donation from the same person living at the same address.
Much like the negative donation values, these types of duplicates are strong signals for garbage data. They could skew the results of any calculations we run on the donation attribute. We will need to remove them as well.
Add the following code to our script to create a new data frame that does not have rows with the same first name, last name, street address, city, and state. This code will keep the first occurrence of any such row and drop any duplicates.
# Remove duplicates
columns_to_check = ['first_name', 'last_name', 'street_address', 'city', 'state']
data_frames_no_dupes = data_frames.drop_duplicates(subset=columns_to_check, keep='first')
print(data_frames_no_dupes.info())
Running the updated script will generate the following info table:
Notice the number of total records in our data_frames_no_dupes data frame has decreased.
Missing Values
Earlier in the article, we saw that we had several missing values across different attributes of the dataset.
These missing values were initially in the first_name, last_name, city, and state attributes. But we have introduced more missing values under the donation attribute by filtering out negative values.
We intentionally saved this step until the end so we could see what remained in our dataset after going through all the other cleaning techniques. Some missing values are tolerable, while others would prevent our dataset analysis.
At this point, we can see that any rows with a missing donation are useless for us, so we will drop those.
Also, a missing state value will throw off our attempt to aggregate donation information by region of the United States. That being the case, we will also opt to drop those rows.
To drop rows with a missing donation or state values, we can add the following code to our script:
# Drop Missing Data
columns_to_check = ['state', 'donation']
data_frames_no_missing = data_frames_no_dupes.dropna(subset=columns_to_check)
print(data_frames_no_missing.head(20))
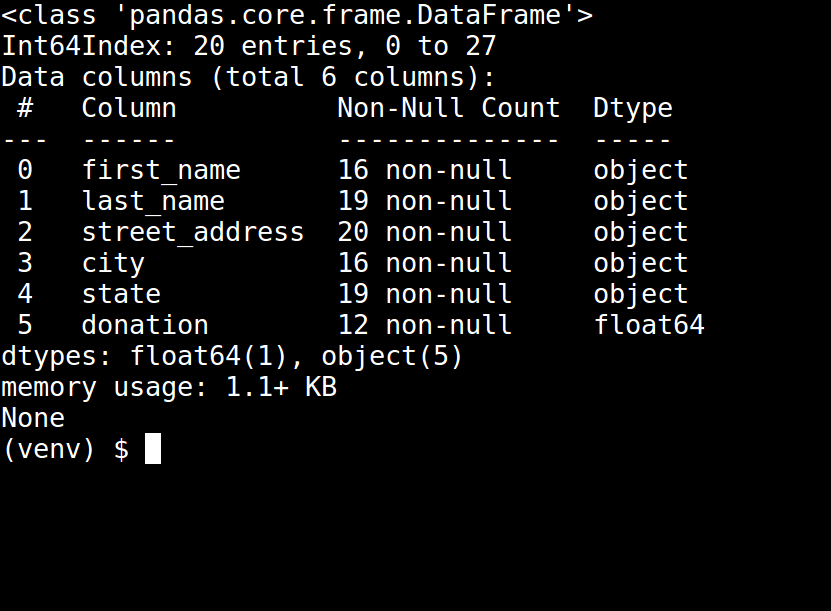
This code will drop any rows that have NaN values in the state or donation columns. Running this updated script will print out the following table:
Our dataset looks much cleaner now!
Now that we have finished cleaning our data, we can export the clean dataset into a new .csv file by adding the following code to our script:
data_frames_no_missing.to_csv(r'clean_donations_data.csv', index=False)This clean dataset file (clean_donations_data.csv) can now be used in subsequent steps of the data analysis pipeline.
Conclusion
In this article, we looked at the process of cleaning data. The process starts by diagnosing the different ways in which our dataset may be inconsistent.
From there, we have many techniques available to clean the data. It is important to have context in the domain of our problem to know which technique is the best fit for the problems we see in our dataset.
Cleaning data is critical because it can help us to avoid drawing erroneous conclusions and acting on faulty assumptions.
If you would like to learn how to explore your data after cleaning it, then go over to my blog, where you will learn about Exploratory Data Analysis in Python.
You can get all the scripts used in this tutorial here.
Learn also: K-Fold Cross Validation using Scikit-Learn in Python
Happy coding ♥
Just finished the article? Why not take your Python skills a notch higher with our Python Code Assistant? Check it out!
View Full Code Fix My Code


Got a coding query or need some guidance before you comment? Check out this Python Code Assistant for expert advice and handy tips. It's like having a coding tutor right in your fingertips!