Confused by complex code? Let our AI-powered Code Explainer demystify it for you. Try it out!
The Histogram of Oriented Gradients (HOG) is a feature descriptor used in computer vision and image processing applications for the purpose of object detection. It is a technique that counts events of gradient orientation in a specific portion of an image or region of interest.
In 2005, Dalal and Triggs published a research paper named Histograms of Oriented Gradients for Human Detection. After the release of this paper, HOG is used in many object detection applications.
Here are the most important aspects of HOG:
- HOG focuses on the structure of the object. It extracts information about the edge's magnitude as well as the orientation of the edges.
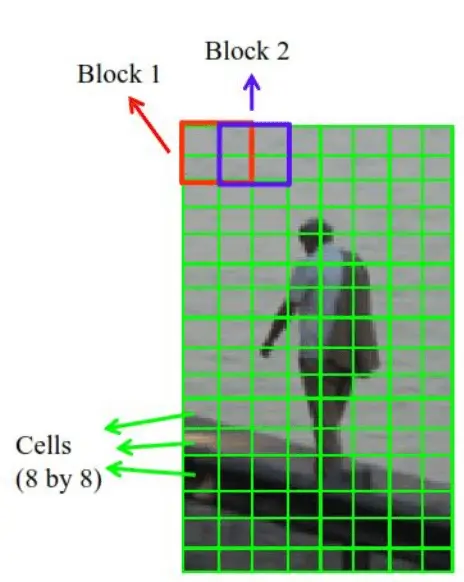
- It uses a detection window of 64x128 pixels, so the image is first converted into
(64, 128)shape. - The image is then further divided into small parts, and then the gradient and orientation of each part are calculated. It is divided into 8x16 cells into blocks with 50% overlap, so there are going to be 7x15 = 105 blocks in total, and each block consists of 2x2 cells with 8x8 pixels.
- We take the 64 gradient vectors of each block (8x8 pixel cell) and put them into a 9-bin histogram.
 Below are the essential steps we take on HOG feature extraction:
Resizing the Image
As mentioned previously, if you have a wide image, then crop the image to the specific part in which you want to apply HOG feature extraction, and then resize it to the appropriate shape.
Calculating Gradients
Now, after resizing, we need to calculate the gradient in the x and y directions. The gradient simply involves small changes in the x and y directions; we must convolve two simple filters on the image.
The filter for calculating the gradient in the x-direction is:
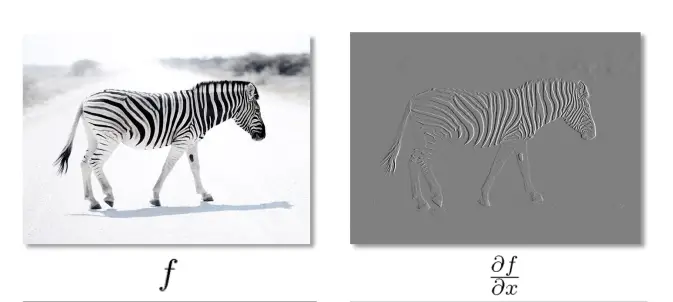
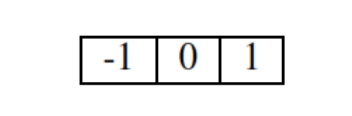 The following is when we apply this filter to an image:
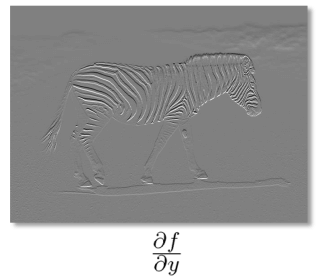
 The filter for calculating the gradient in the y-direction is:
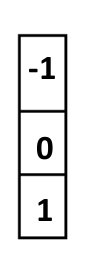 The following is when we apply this filter to an image:
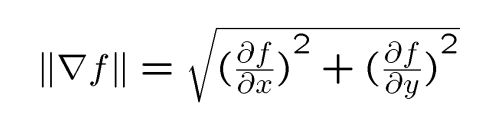
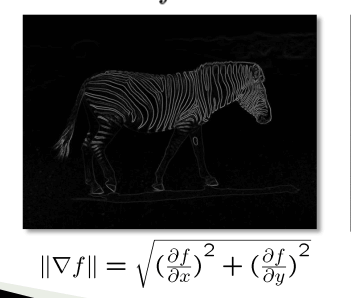
Calculating the Magnitude
To calculate the magnitude of the gradient, the following formula is used:
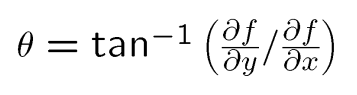
Calculating the Orientation
The gradient direction is given by:
 Let's take an example, say we have the matrix below:
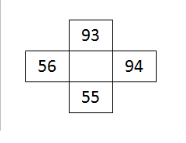 The gradient in the x-axis will simply be 94-56 = 38, and 93-55 = 38 in the y-axis.
The magnitude will be:
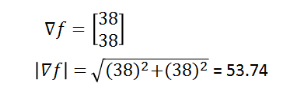 The gradient direction will be:
![]()
Related: Mastering YOLO: Build an Automatic Number Plate Recognition System with OpenCV in Python.
Python Code
Now that we understand the theory, let's look at how we can use scikit-image library to extract HOG features from images.
First, let's install the necessary libraries for this tutorial:
pip3 install scikit-image matplotlibI will perform HOG on a cute cat image, get it here, and put it in the current working directory (you can use any image you want, of course). Let's load the image and show it:
#importing required libraries
from skimage.io import imread
from skimage.transform import resize
from skimage.feature import hog
from skimage import exposure
import matplotlib.pyplot as plt

# reading the image
img = imread('cat.jpg')
plt.axis("off")
plt.imshow(img)
print(img.shape)
Output:
(1349, 1012, 3) Resizing the image:
# resizing image
resized_img = resize(img, (128*4, 64*4))
plt.axis("off")
plt.imshow(resized_img)
print(resized_img.shape)
Output:
(128, 64, 3)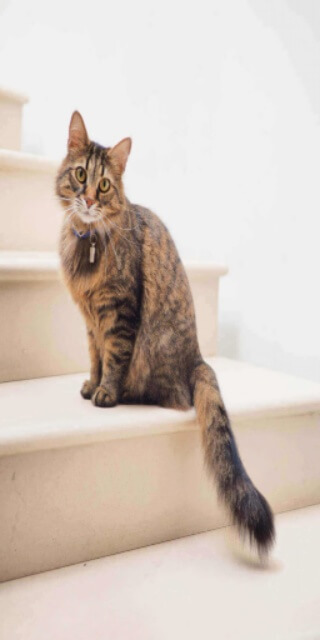 Now, we simply use
 hog() function from scikit-image library:
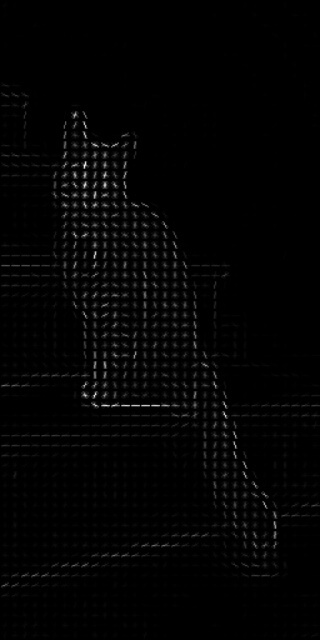
#creating hog features
fd, hog_image = hog(resized_img, orientations=9, pixels_per_cell=(8, 8),
                	cells_per_block=(2, 2), visualize=True, multichannel=True)
plt.axis("off")
plt.imshow(hog_image, cmap="gray")
Output:
The hog() function takes 6 parameters as input:
image: The target image for which you want to apply HOG feature extraction.orientations: Number of bins in the histogram we want to create, the original research paper used 9 bins so we will pass 9 as orientations.pixels_per_cell: Determines the size of the cell; as we mentioned earlier, it is 8x8.cells_per_block: Number of cells per block will be 2x2 as mentioned previously.visualize: A boolean is used to decide whether to return the image of the HOG. We set itTrueso we can show the image.multichannel: We set it toTrueto tell the function that the last dimension is considered as a color channel instead of spatial.
Finally, if you want to save the images:
# save the images
plt.imsave("resized_img.jpg", resized_img)
plt.imsave("hog_image.jpg", hog_image, cmap="gray")
Conclusion
Alright, now you know how to perform HOG feature extraction in Python with the help of scikit-image library.
Check the full code here.
Related tutorials:
- How to Detect Contours in Images using OpenCV in Python.
- How to Detect Shapes in Images in Python using OpenCV.
- Mastering YOLO: Build an Automatic Number Plate Recognition System with OpenCV in Python.
- How to Perform Edge Detection in Python using OpenCV.
Happy Learning ♥
Save time and energy with our Python Code Generator. Why start from scratch when you can generate? Give it a try!
View Full Code Assist My Coding


Got a coding query or need some guidance before you comment? Check out this Python Code Assistant for expert advice and handy tips. It's like having a coding tutor right in your fingertips!